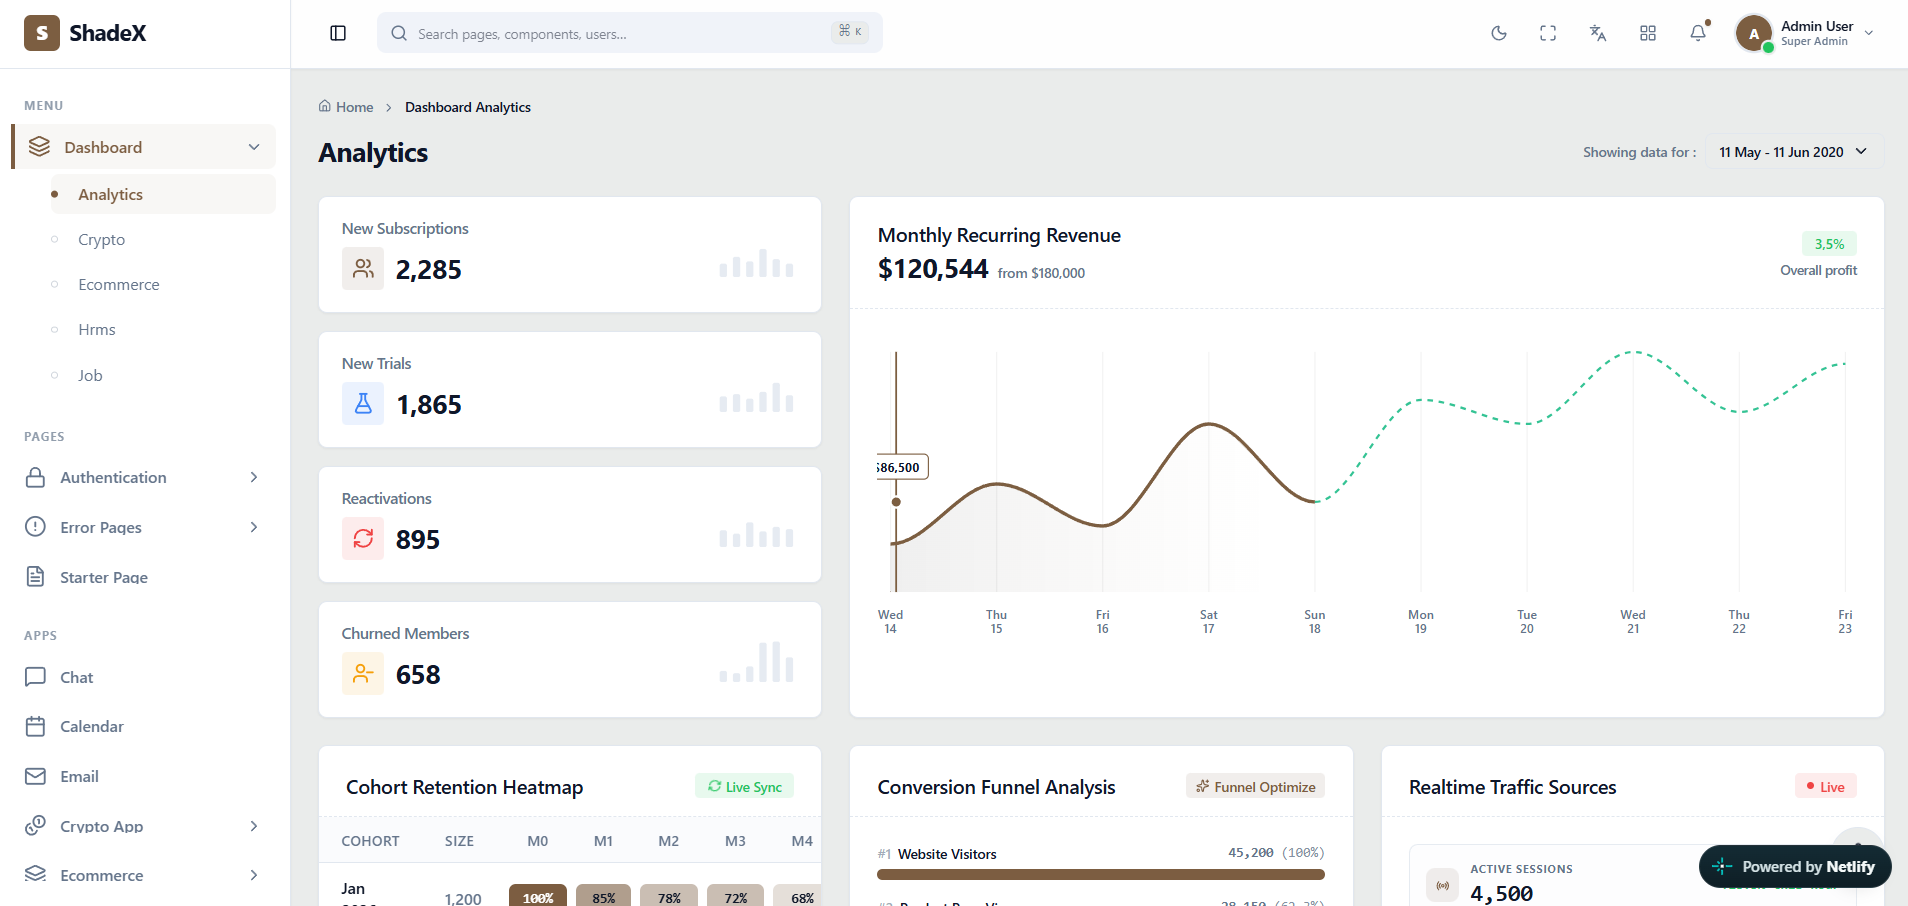
 Actual ShadeX Analytics dashboard interface screenshot — click to explore the online demo
What makes this admin interface useful?
An analytics dashboard is most effective when high-level indicators lead naturally into deeper reports. ShadeX pairs KPI cards with larger visualization surfaces so users can quickly move from new subscriptions to recurring revenue, conversion funnels and retention trends.
ShadeX uses React 18, Vite, Tailwind CSS, shadcn/ui components based on Radix primitives, React Router v7 and Zustand. Developers can adapt its presentation to their own data models, branding and workflows. This showcase explains what you can explore in the template; it does not replace the live demo or documentation.
Key screens and UI patterns
- Subscription KPIs, trials and churn trends.
- Monthly recurring revenue charts and revenue comparison.
- Cohort retention heatmaps and conversion funnel views.
- Traffic acquisition and real-time session UI.
Explore the live preview to evaluate content density, filtering UI, responsiveness, charts and navigation patterns. The full item listing identifies which screens ship with ShadeX.
Where can you use this template?
SaaS subscription reporting portal
Adapt the ShadeX layouts, components and interaction patterns to your project requirements.
Marketing performance admin console
Adapt the ShadeX layouts, components and interaction patterns to your project requirements.
Customer success insights workspace
Adapt the ShadeX layouts, components and interaction patterns to your project requirements.
Customizing ShadeX for your project
Start with the screen and layout
Compare vertical, horizontal and boxed navigation variants. Map your application modules to the sidebar or header structure, then remove screens you do not need. Choose one of the supplied Light, Dark or Galaxy themes to keep your interface consistent as it grows.
Connect your application services
Replace example values with your own API data and validation logic. Use the included form, table, chart, dialog and notification patterns to build the experiences required by your users. International projects can adapt the built-in localization architecture for English, Hindi, Arabic and Italian.
Scope and implementation expectations
Charts and numbers shown in the demo are illustrative UI data, not live connected customer analytics. Always check official included-file details, software versions, license requirements and support information on ThemeForest before purchasing.
Frequently asked questions
What is included in the analytics dashboard?+
This preview covers subscription kpis, trials and churn trends, monthly recurring revenue charts and revenue comparison, cohort retention heatmaps and conversion funnel views. The actual ShadeX demo and documentation show specific implementations.
Who can use this interface?+
SaaS analytics teams and founders can use the templates as a frontend starting point for their own systems.
Is ShadeX a working backend application?+
No. ShadeX is a React admin interface template. Connect your own backend, APIs and storage for production business operations.
Can I preview the actual screens?+
Yes. Open the official ShadeX live demo to explore the included interface and behavior before purchasing.
Does it include RTL and dark mode?+
Yes. The official listing describes RTL support plus Light, Dark and Galaxy themes.
Where can I buy ShadeX?+
Purchase and verify current licensing terms on the official ShadeX item page on ThemeForest.